Solar Panel Cost Calculator
Enter your bill or upload it. Get system size, cost breakdown, savings & payback in 30 seconds.
Both solar markets just had the rug pulled out from under them in the same six-week stretch, and most cost calculators haven’t noticed. In the US, the 30% federal tax credit (Section 25D) expired on December 31, 2025. In Pakistan, NEPRA killed one-for-one net metering on February 9, 2026. If your calculator still bakes in the old US credit or the old Pakistani buyback rate, the number it shows you is fiction.
This solar panel cost calculator runs the honest 2026 math for both countries. Enter your details and you’ll get your real price per watt, your true out-of-pocket cost, and a payback period built on what you actually pay per unit. Every price table below shows the US and Pakistan side by side, so whether you’re pricing a system in Karachi or California, you can read any installer quote like someone who’s seen a hundred of them.
Solar Panel Prices by Brand in 2026
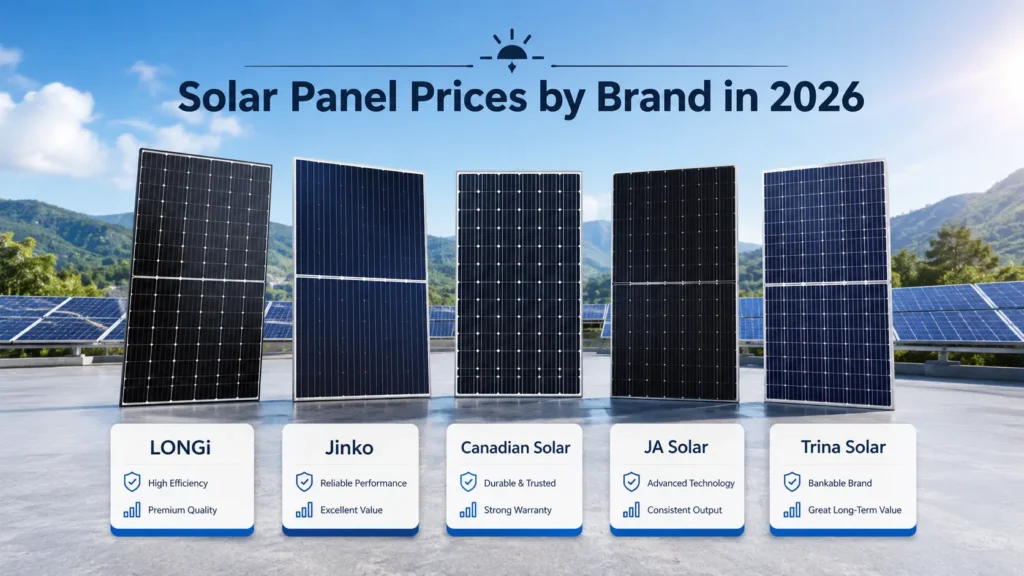
The same brands sell in both markets, but US module prices run higher because of import tariffs Pakistan doesn’t levy. Premium Western brands like Maxeon and REC are common in the US and rarely stocked in Pakistan, while value brands like Jinko, Trina, and Longi dominate Pakistani rooftops. Here’s the module-level pricing, equipment only:
| Panel Brand | US Module $/Watt | Pakistan PKR/Watt |
|---|---|---|
| Trina (Vertex) | $0.25 – $0.34 | Rs. 41 – 42 |
| Jinko (Tiger Neo) | $0.25 – $0.34 | Rs. 45 – 47 |
| JA Solar | $0.28 – $0.36 | Rs. 44.50 – 45 |
| Longi (Hi-MO) | $0.30 – $0.34 | Rs. 44.50 – 49 |
| Canadian Solar | $0.30 – $0.40 | Rs. 49.60 – 50 |
| Astronergy (Astro) | $0.30 – $0.40 | Rs. 43 – 47 |
| AIKO | $0.42 – $0.55 | Rs. 44 (620W) |
| REC Alpha | $0.45 – $0.58 | Rarely stocked |
| Maxeon (ex-SunPower) | $0.50 – $0.65 | Rarely stocked |
| Panasonic | Discontinued | Rarely stocked |
One real heads-up on that last row for US readers: Panasonic exited the residential solar business on April 28, 2025, so its panels are gone for new installs even though existing warranties hold. In Pakistan, the live concern is grade instead of availability. A-grade documented panels run the rates above, while B-grade and undocumented panels sell for Rs 25 to 35 per watt with no real warranty and faster degradation. In both countries, the panel is a small slice of the total, so paying up for a premium brand rarely moves your final bill much.
How Much Do Solar Panels Cost in 2026?
A typical home solar system costs about $22,800 in the US (8 kW) or roughly Rs 7,00,000 to 8,50,000 in Pakistan (8 kW on-grid) as of June 2026, before any incentives. The US figure works out near $2.85 per watt installed, per Energy Sage and NREL benchmarks, while Pakistan’s on-grid systems land closer to Rs 75 to 95 per watt. Here’s the full lineup by system size:
| System Size | US (USD) | Pakistan (PKR) |
|---|---|---|
| 3 kW | $8,550 | Rs. 3,50,000 – 4,50,000 |
| 5 kW | $14,250 | Rs. 5,50,000 – 7,00,000 |
| 8 kW | $22,800 | Rs. 7,00,000 – 8,50,000 |
| 10 kW | $28,500 | Rs. 7,50,000 – 9,50,000 |
| 12 kW | $34,200 | Rs. 9,50,000 – 11,50,000 |
| 15 kW | $42,750 | Rs. 12,20,000 – 15,00,000 |
These are native-currency figures, not conversions, because the two markets price independently. The US median install is now 8 kW (up from 6 kW five years ago) as homeowners add EV charging and heat pumps. In Pakistan, the air conditioner drives everything, so the popular sizes cluster around 5 to 10 kW for cooling a full house through summer load-shedding.
What Determines Your Solar Cost?
Five things set your final price in both countries: system size, location, equipment quality, roof complexity, and installer competition. The panels are the cheap part everywhere. Solar hardware is only about 15% of a US installed cost, with the other 85% in labor, permits, and overhead.
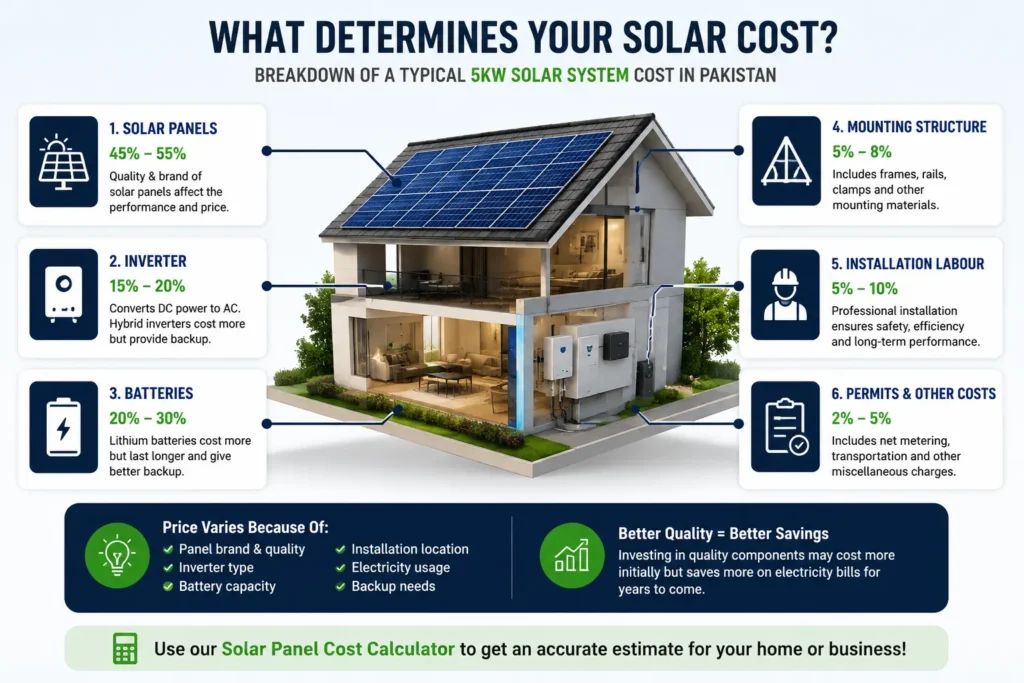
I call this the 15/85 split. In Pakistan the split is gentler because the soft 85% is so much cheaper, which is exactly why the same panels yield such a lower total. Here’s where your money goes in each market:
| Cost Component | US Share | Pakistan Share |
|---|---|---|
| Panels (modules) | ~15% | ~35–45% |
| Inverter | ~10% | ~15–20% |
| Labor + install | ~15% | ~8–12% |
| Permits + interconnection | ~7% | ~3–5%(plus processing) |
| Sales, overhead, margin | ~25% | ~10–15% |
| Other soft costs | ~28% | ~15–20% |
Notice how the panel share nearly triples in Pakistan, not because panels cost more there (they cost less), but because everything around them costs so little that the hardware becomes the dominant line item. In the US, the hardware is almost an afterthought next to the soft costs. This is the single biggest structural difference between the two markets.
Why Does the US Pay 10 Times More Per Watt?
The US pays roughly ten times more per watt than Pakistan for the same panels, and almost none of that gap is the hardware. It’s tariffs plus soft costs. A 10 kW system that costs about $28,500 in the US costs the equivalent of $2,700 to $3,400 in Pakistan. Same Jinko or Trina panels on the roof, wildly different total.
Two forces explain the whole thing. First, US import tariffs and anti-dumping duties push module prices well above what a Pakistani buyer pays for the identical panel shipped straight from China. Second, the soft costs (labor, permitting, inspection, customer acquisition, and installer margin) make up about 85% of a US install, and those costs are a fraction as high in Pakistan. The panels are nearly a global commodity. Everything around them is local, and that’s where the ten-fold gap lives.
How to Use the Solar Panel Cost Calculator?
This calculator gives you a full solar system cost estimate in three steps. You can either upload a photo of your electricity bill (the AI reads it automatically) or enter your bill amount manually. Both methods take under 30 seconds.
Step 1: Enter Your Electricity Bill
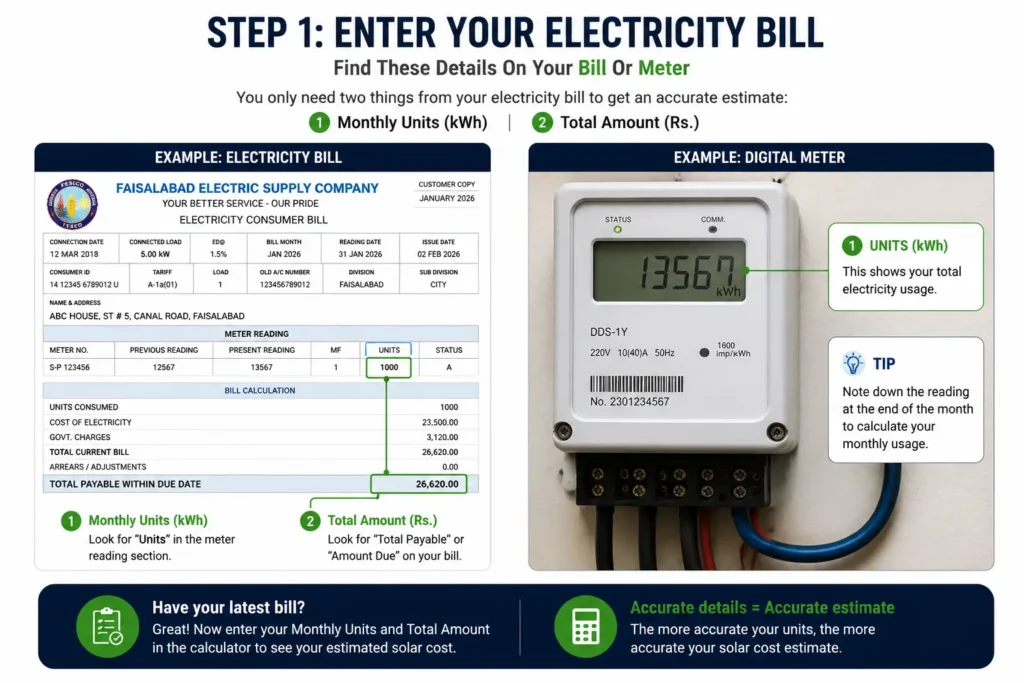
Option A Upload Your Bill (Recommended):
Tap “Upload Bill” and take a photo of your WAPDA, LESCO, IESCO, K-Electric, FESCO, or any DISCO electricity bill. The AI reads your bill and automatically extracts six data points: total units consumed, bill amount, your DISCO name, sanctioned load (your maximum allowed system size under 2026 NEPRA rules), meter type (single-phase or three-phase), and tariff category (protected or non-protected).
After extraction, you’ll see your bill data displayed in a card grid. The AI also generates three personalized recommendations based on your specific bill system size advice, on-grid vs hybrid suggestion, and realistic savings estimate. Your bill image is processed in real-time and never stored.
Option B Enter Manually:
Tap “Enter Manually” and type your monthly electricity bill amount in PKR. The calculator works for bills starting from Rs. 3,000, but solar typically pays back strongly for bills above Rs. 8,000-10,000 per month.
After entering your bill, select your city from the grid. The calculator covers 17 Pakistani cities (Lahore, Karachi, Islamabad, Rawalpindi, Faisalabad, Multan, Peshawar, Quetta, Hyderabad, Gujranwala, Sialkot, Bahawalpur, Abbottabad, Sahiwal, Mardan, Sukkur) plus an “Other City” option. Each city has different peak sun hours and dealer pricing, so this selection affects your final estimate.
Step 2: Choose Your Equipment Preferences
This step lets you customize your system with three selections:
Panel Brand
Select an A-grade documented panel brand. Changing the brand instantly updates the total system cost.
Battery Option
Choose between the lowest upfront cost, affordable backup or premium long-term energy storage.
Inverter Brand
Compare inverter brands according to warranty period, price range and long-term reliability.
Step 3: Review Your Results
The results screen shows everything you need to evaluate your solar investment:
How Much Does Solar Cost by Region?
Location swings your price in both countries, and the pattern is the same: competitive urban markets are cheapest, remote regions cost more. In the US the spread runs over a dollar per watt between states. In Pakistan it’s a 5 to 8% gap between the big installer hubs and the outlying cities.
There’s a twist that catches people in both markets: the priciest region can be the better investment. Massachusetts has the highest install cost in the US, yet it pays back fast because electricity there is so expensive. The next section is where that logic lives, and it matters even more in Pakistan.
Why Your Electricity Rate Matters More Than Sunshine?
The value of solar is set by what you pay per unit, not by how sunny you are. I call it the Rate-First Rule: check your tariff before you check anything else. This is why Pakistan, despite cheaper systems, often beats the US on payback, and why expensive US states beat cheap sunny ones.
Pakistan’s payback is faster because grid power is brutally expensive relative to the cheap system cost. A Pakistani household paying Rs 40 per unit recovers a Rs 8 lakh system in three to four years. In the US, a California home on a $0.45 rate pays back in about four years while a Texas home on $0.12 takes closer to sixteen, on the identical system. Whatever country you’re in, run the calculator with your real rate off a recent bill, because that number does the heavy lifting.
What Changed in 2026: US and Pakistan Policy
Both markets gutted their export incentives within weeks of each other, and this is the change that breaks old calculators. In the US the federal purchase credit ended. In Pakistan the one-for-one export deal ended. Here’s the side-by-side:
For US buyers, the practical effect is that cash and loan purchases get no federal credit in 2026, while a lease or power purchase agreement can still capture value because the installer claims the commercial 48E credit and passes part of it back.
For Pakistani buyers, new connections now export surplus at roughly Rs 8 to 11 per unit (the notified rate for new prosumers is Rs 8.13) while still buying grid power at Rs 33 to 48. As of June 2026, Pakistan’s grandfathering for pre-February contracts is still under review after the Prime Minister intervened, so don’t treat it as settled. In both countries, tax and tariff rules can shift, so confirm specifics locally before you sign.
How to Calculate Solar Panel Cost Manually?
You can sanity-check any quote in four steps using just your electricity bill, and the method works in both currencies. Installers use the same arithmetic.
- Find your annual usage. Pull 12 months of kilowatt-hours (US) or units (Pakistan) off your bills.
- Size the system. Divide annual usage by your area’s production per kW (about 1,300–1,600 kWh in the US, or use 120 units per kW per month as a Pakistan rule of thumb).
- Apply price per watt. Multiply system watts by your local rate: $2.85/W in the US, or Rs 75–95/W on-grid in Pakistan.
- Estimate payback. Divide system cost by annual savings, where savings equals production times your retail rate.
Then hold your quote against this reference band to catch an overcharge in either market:
This is also how you catch a lying calculator. If an online tool’s out-of-pocket number is far below your hand math, check whether it’s still applying the dead US 30% credit or the old Pakistani Rs 25.9 buyback. As of 2026, those are the two most common stale assumptions baked into solar tools.
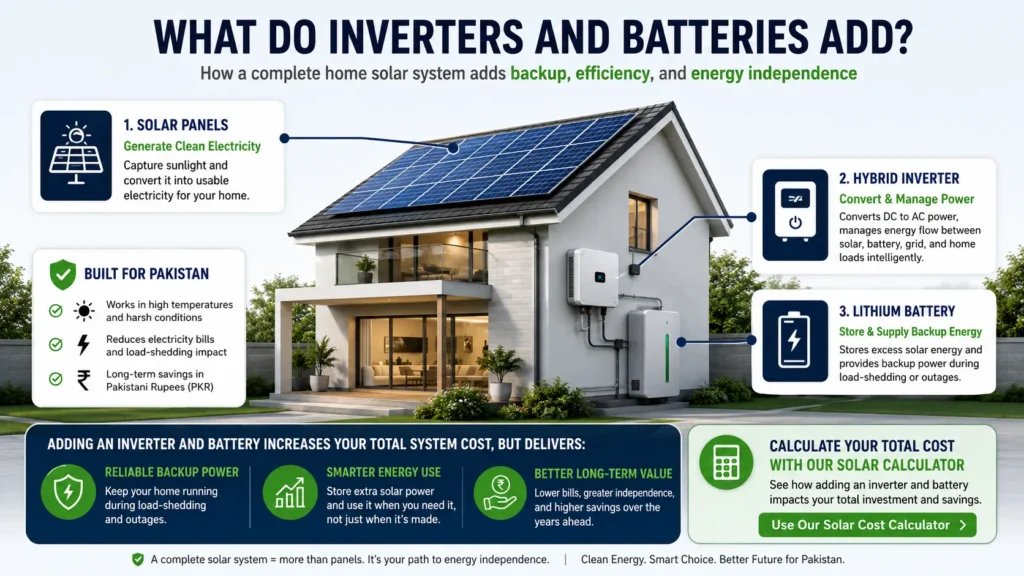
What Do Inverters and Batteries Add?
The inverter is roughly 10% of your cost, and a battery can rival the price of the panels. These two choices move your total most after the panels, in both markets.
My honest take in both markets: skip the battery until you actually need one. In the US a Powerwall 3 adds about $13,500 and rarely improves grid-tied ROI unless you have outages or time-of-use rates. In Pakistan, the calculus flips toward storage faster because of load-shedding and the now-poor export rate, but lithium is still a major spend, and tubular batteries die in three to four years. Add storage when your situation demands it, not by default.
How Much Does a Tesla Solar Roof Cost?
A Tesla Solar Roof costs $40,000 to over $100,000-plus installed in the US, because it replaces your whole roof and only makes financial sense if you already needed one. It runs well above $4 per watt for the solar portion alone, versus the $2.58 to $3.00 US average for standard panels.
For Pakistani readers, this one is academic: the Solar Roof isn’t a real option in the local market, and at local prices it wouldn’t make sense anyway. Standard panels on an existing roof win on cost per watt almost everywhere, in both countries, unless your roof is genuinely due for replacement.
What’s the Payback and Lifetime Cost Per Unit?
Solar’s lifetime cost lands far below grid rates in both countries, which is the real reason it pays. Divide total system cost by 25 years of production and you get a cost per unit that grid power can’t touch.
The US numbers come from Solar Insurer’s 2026 modeling at the $0.173 average rate with 2.89% annual escalation. Pakistan’s roughly Rs 4 per unit lifetime cost against a Rs 33 to 48 grid rate is why payback there is so short despite the policy hit. The 2026 incentive cuts stretched payback by a couple of years in both countries, but neither change touched this fundamental gap between Solar’s lifetime cost and a rising bill.
Final Thoughts
A typical 8 kW home system costs about $22,800 in the US or Rs 7,00,000 to 8,50,000 in Pakistan as of June 2026, before incentives, per EnergySage, NREL, and Pakistani dealer-market data. The US pays roughly ten times more per watt than Pakistan, driven almost entirely by import tariffs and the 85% soft-cost stack, not by the panels, which are nearly a global commodity.
Both markets cut export incentives in 2026: the US 30% credit (Section 25D) expired December 31, 2025, and Pakistan replaced net metering with net billing on February 9, 2026, dropping the buyback rate to roughly Rs 8 to 11 per unit Self-consumption now beats export in both countries. US leases and PPAs can still capture the 48E credit through 2027, while Pakistani exports barely pay, so sizing for daytime use is the winning move.